Abstract:
Background: Although the techniques to interrogate the appearance of a biomarker in tissue sections have greatly advanced, there are limitations as to how representative an analysis of a tissue section is compared with that of the entire diseased tissue. Depending on the heterogeneous expression level of a biomarker, tissue sampling can result in different interpretations of the biomarker’s appearance and hence could lead to a false result regarding the biomarkers presence. Such inaccurate data, of course, could result in ineffective patient care decisions.
Hypothesis: Digital image analysis has demonstrated tremendous value in quantifying many features related to biomarker distribution and expression in biological tissues. The information can be collected for various indications and biomarkers, and a phenotypic signature can be established that describes a biomarker representation across indications. Moreover, the assessment of new samples can be compared with the established phenotypic signature, and a confidence designation can be applied in support of the determined end point.
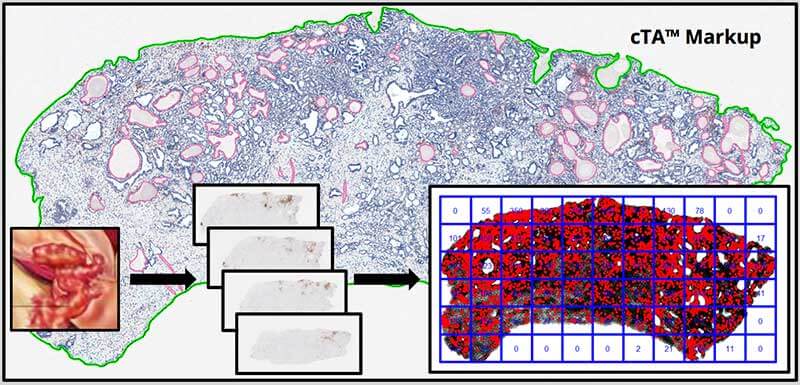
Approach: For a proof of concept, 6 prostate cancer samples were processed, and a single section was collected after every 100 μm. A total of 7 sections per sample were stained for the lymphocyte marker CD3, and the number of positive target cells was determined in the tumor using Computational Tissue Analysis (cTA™). To assess how indicative the evaluation of a single tissue section would be for the entire tumor, the heterogeneity level was determined on the section level as well as by random grid analysis on each individual section. Both criteria were utilized to define an indication- and biomarker-specific confidence score.
Conclusion: The combination of immunohistochemistry (IHC) and cTA™ is a powerful tool to convert complex data into meaningful interpretations. cTA™ is also capable of cataloguing valuable information about a biomarker’s expression pattern across different disease stages and hence could be used to evaluate how representative a single biomarker evaluation is in the grand scheme. Ultimately Flagship Biosciences has demonstrated a technique that can be applied to any biomarker and would assist in guiding therapeutic decisions.
