Industry has accepted relative scoring of toxicity lesions for many years. However, the real demand from investigators in the area of discovery toxicology is for quantitative toxicological pathology data.
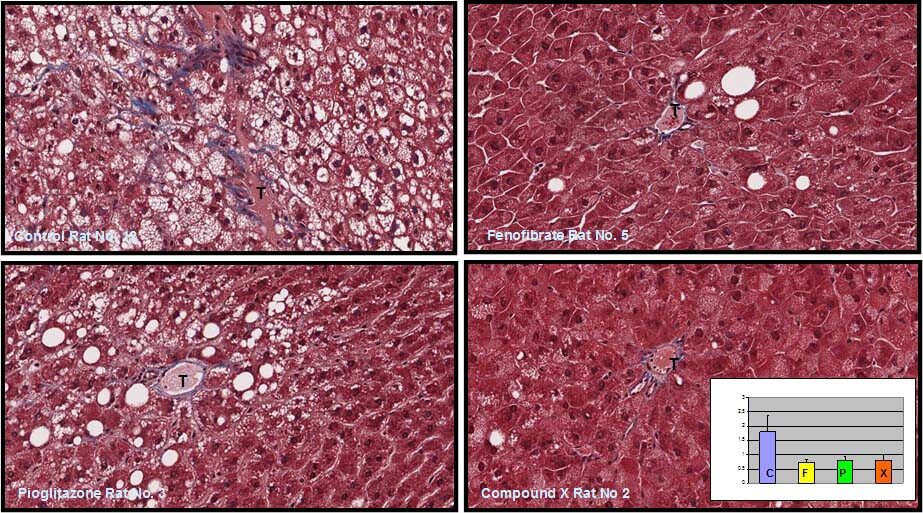
In the scenario below, there are four images of periportal fibrosis in the livers of diabetic rats. The upper left, the control, clearly shows an increase in liver fibrosis as compared to the other three, on fenofibrate, pioglitazone, and a proprietary compound X. I can see levels of fibrosis as a pathologist, and grade according to the common four level scores of minimal, mild, moderate or marked.
Alternatively, with image analysis I can deliver quantitative toxicological pathology data to my investigators, as the graph (insert) shows. With more data I can then look at whether there are any statistically significant differences in terms of percent area of fibrosis between the control and these three compounds. Quantitation allows others, especially non-pathologists, to see and confirm what I am seeing.